Benchmarks
This package archives the current scripted dependency-tracking benchmark suite used to demonstrate how the system records conversations, tracks causal dependencies between generated artifacts, and reconstructs editable text state over time. It includes turn-by-turn scripted conversations, dependency-graph snapshots, rendered graph visualizations, and any conversation, theory, or memory text-state ledgers present in each benchmark directory.
For readers coming from the main essay, this suite is best read as a collection of small, concrete provenance examples rather than as a benchmark leaderboard. Each package shows the scripted exchange that produced the run, the dependency graph that records what depended on what, and the piece-table ledgers that let the system reconstruct editable conversation, theory, and memory text state afterward.
Download bundle:
How to Read This Suite
These are scripted fixture-driven examples, not live training artifacts. They are included here because they make the dependency-tracking claims in the essay inspectable in compact, low-stakes runs.
- Paired benchmarks group two linked conversations so you can see how provenance and text state carry across a boundary between related runs.
- Single benchmarks show one scripted run in isolation.
- Proxy computations are runs where dynamically executed knowledge or memory code calls platform APIs such as
conversation,memory, ortutorfrom inside the executed Python itself. These examples are included to show that dependency tracking still records those API results when the calls happen during dynamic code execution, not only when the model emits direct API calls.
Core file types:
scripted_conversations.json: Reconstructed turn-by-turn scripted conversation used to generate the benchmark.dependency_graph.json: Machine-readable provenance graph for the benchmarked run.dep_viz_*.png: Rendered dependency-graph images for quick visual inspection in a browser.pt_conv_*.json: Conversation piece-table ledger showing how dialogue text is stored and reconstructed.pt_kf_*.json: Theory/knowledge piece-table ledger showing how executable theory text is stored and reconstructed.pt_mem_*.json: Memory piece-table ledger for benchmarks in which memory state participates.
Suite Preview
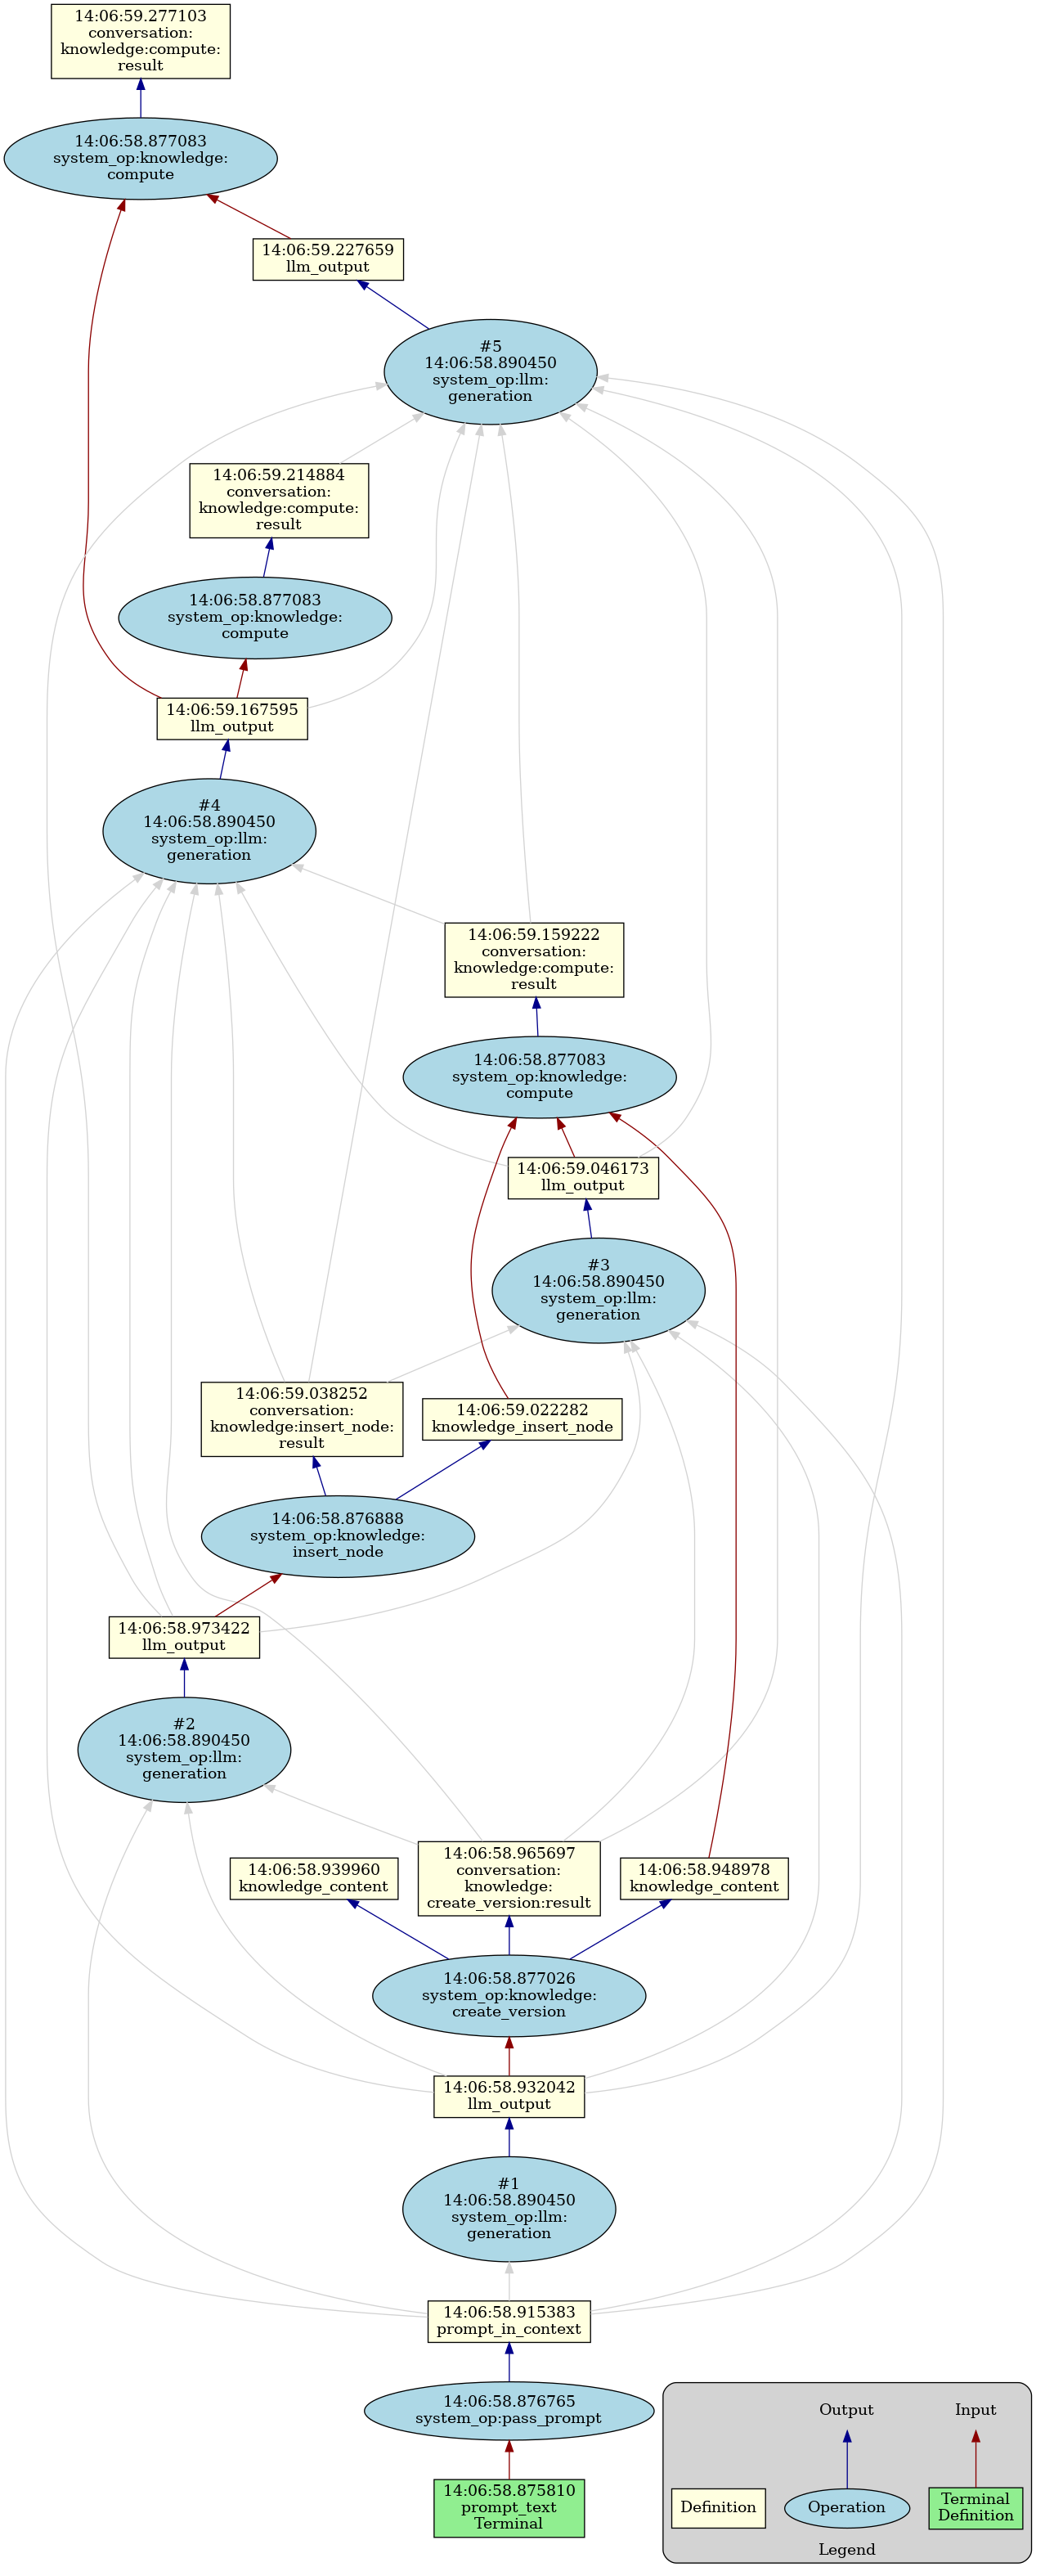
The preview image is representative of the suite’s rendered dependency graphs: operations, definitions, and API results are linked by recorded “used-to-produce” dependencies. The point of the suite is not any single graph shape, but the fact that each scripted benchmark preserves enough structure to reconstruct both the causal graph and the editable text state behind it.
Suite Summary
- Total benchmarks:
22 - Paired benchmarks:
3, each spanning two linked scripted conversations - Single benchmarks:
19, each showing one isolated scripted run - Every benchmark includes: reconstructed scripted conversations, a machine-readable dependency graph, and at least one rendered graph image
- Included text-state ledgers: conversation ledgers for all benchmarks, theory ledgers for most benchmarks, and memory ledgers when memory state participates
- Excluded from this public bundle: runtime logs, event logs, raw knowledge files, observation snapshots, performance outputs, and Graphviz source files
Suite Files
- README.md (1.06 KB): Plain-language overview of the suite and its inclusion rules.
- suite_manifest.json (18.0 KB): Suite-level overview covering the benchmark counts, shared runtime, and reader-facing per-benchmark summaries.
Benchmark Browser
Each benchmark card gives a quick summary of what the example contains, including the API action types exercised in each scripted conversation. Some examples exercise direct API calls, while the proxy-computation examples exercise API calls made from inside dynamically executed knowledge or memory code. Expand Raw file links to open the underlying files directly in the browser. The published raw JSONs have had absolute host paths stripped so the focus stays on the dependency data itself.
Paired Benchmarks
Conversations 1 and 2
Two-conversation knowledge-version example showing inserted-node dependencies, then a follow-up version where static knowledge dependencies persist but prior dynamic state does not.
Conversation 1 API actions: knowledge.create_version | knowledge.insert_node | knowledge.compute
Conversation 2 API actions: knowledge.create_version | knowledge.read_version | knowledge.compute
2 graph renders4 ledgersconversation and theory ledgers
Raw file links
Core files: scripted_conversations.json (8.33 KB) | dependency_graph.json (35.9 KB)
Visualizations: dep_viz_03-19T14-06-59-277103.png (454 KB) | dep_viz_03-19T14-06-59-911629.png (414 KB)


Text-state ledgers: pt_conv_03-19_14-06-58-916324.json (7.01 KB) | pt_conv_03-19_14-06-59-657542.json (7.85 KB) | pt_kf_03-19T14-06-58-947846.json (1015 B) | pt_kf_03-19T14-06-59-674883.json (912 B)
Conversations 3 and 4
Tutor-guided learning example that stores topics in memory, writes a new function to knowledge, and then reuses that memory and knowledge state in a follow-up observation.
Conversation 3 API actions: tutor.send | memory.insert_node | memory.compute | knowledge.create_version | knowledge.insert_node | observe.observe
Conversation 4 API actions: memory.compute | knowledge.insert_node | knowledge.compute | observe.observe
4 graph renders7 ledgersconversation, theory, and memory ledgers
Raw file links
Core files: scripted_conversations.json (8.04 KB) | dependency_graph.json (46.3 KB)
Visualizations: dep_viz_03-19T14-07-00-904754.png (856 KB) | dep_viz_03-19T14-07-00-976892.png (41.1 KB) | dep_viz_03-19T14-07-02-560767.png (809 KB) | dep_viz_03-19T14-07-02-643094.png (45.4 KB)


Text-state ledgers: pt_conv_03-19_14-07-00-438236.json (7.81 KB) | pt_conv_03-19_14-07-00-977972.json (3.32 KB) | pt_conv_03-19_14-07-01-976963.json (5.96 KB) | pt_conv_03-19_14-07-02-643179.json (3.32 KB) | pt_kf_03-19T14-07-00-629031.json (380 B) | pt_kf_03-19T14-07-02-125517.json (506 B) | pt_mem_memory_py_0d9221a2df4d.json (240 B)
Conversations 5 and 6
Memory-editing example that builds and revises storage helpers, then separately exercises observation, version listing, and promotion behavior across knowledge versions.
Conversation 5 API actions: memory.read | memory.insert_node | memory.compute | knowledge.create_version | knowledge.compute | memory.find_all_nodes | memory.replace_node
Conversation 6 API actions: knowledge.create_version | knowledge.list_versions | observe.observe
3 graph renders7 ledgersconversation, theory, and memory ledgers
Raw file links
Core files: scripted_conversations.json (9.85 KB) | dependency_graph.json (49.3 KB)
Visualizations: dep_viz_03-19T14-07-05-668292.png (1.49 MB) | dep_viz_03-19T14-07-07-573054.png (498 KB) | dep_viz_03-19T14-07-07-660405.png (88.0 KB)


Text-state ledgers: pt_conv_03-19_14-07-04-668578.json (9.51 KB) | pt_conv_03-19_14-07-07-158735.json (6.87 KB) | pt_conv_03-19_14-07-07-640895.json (3.90 KB) | pt_kf_03-19T14-07-04-951391.json (261 B) | pt_kf_03-19T14-07-07-204579.json (223 B) | pt_kf_03-19T14-07-07-241298.json (401 B) | pt_mem_memory_py_4629beeedabe.json (1.03 KB)
Single Benchmarks
Conversation 7
Knowledge proxy-computation example covering dynamic code that calls the conversation API directly for context clearing, appended notes, and multiple API calls inside one computed expression.
Conversation 7 API actions: knowledge.create_version | knowledge.compute
1 graph render2 ledgersconversation and theory ledgers
Raw file links
Core files: scripted_conversations.json (4.43 KB) | dependency_graph.json (28.5 KB)
Visualizations: dep_viz_03-19T14-07-09-491369.png (461 KB)

Text-state ledgers: pt_conv_03-19_14-07-08-596794.json (7.00 KB) | pt_kf_03-19T14-07-08-621848.json (832 B)
Conversation 8
Precise dynamic-dependency example combining imported symbols, inserted helper functions, and redefined dynamic values in date computations.
Conversation 8 API actions: knowledge.create_version | knowledge.insert_node | knowledge.compute
1 graph render2 ledgersconversation and theory ledgers
Raw file links
Core files: scripted_conversations.json (6.47 KB) | dependency_graph.json (33.7 KB)
Visualizations: dep_viz_03-19T14-07-11-086441.png (1.66 MB)

Text-state ledgers: pt_conv_03-19_14-07-10-208786.json (9.39 KB) | pt_kf_03-19T14-07-10-239685.json (1.24 KB)
Conversation 9
Dynamic-state reload example showing that module edits reset transient computed values until those values are established again.
Conversation 9 API actions: knowledge.create_version | knowledge.compute | knowledge.insert_node
1 graph render2 ledgersconversation and theory ledgers
Raw file links
Core files: scripted_conversations.json (5.11 KB) | dependency_graph.json (31.2 KB)
Visualizations: dep_viz_03-19T14-07-13-782131.png (1.30 MB)

Text-state ledgers: pt_conv_03-19_14-07-12-868209.json (9.20 KB) | pt_kf_03-19T14-07-12-898005.json (382 B)
Conversation 10
Find-operations example covering function, class, method, index-path, and XPath-style node queries over a small knowledge module.
Conversation 10 API actions: knowledge.create_version | knowledge.insert_node | knowledge.find_node | knowledge.find_all_nodes
1 graph render2 ledgersconversation and theory ledgers
Raw file links
Core files: scripted_conversations.json (9.90 KB) | dependency_graph.json (54.4 KB)
Visualizations: dep_viz_03-19T14-07-18-492005.png (6.65 MB)

Text-state ledgers: pt_conv_03-19_14-07-14-946889.json (18.3 KB) | pt_kf_03-19T14-07-14-976173.json (1.21 KB)
Conversation 11
CST-editing example covering inserts, replacements, reordering, nested class edits, and one intentionally invalid insertion target.
Conversation 11 API actions: knowledge.create_version | knowledge.insert_node | knowledge.replace_node | knowledge.move_node
1 graph render2 ledgersconversation and theory ledgers
Raw file links
Core files: scripted_conversations.json (10.00 KB) | dependency_graph.json (53.8 KB)
Visualizations: dep_viz_03-19T14-07-28-835117.png (3.11 MB)

Text-state ledgers: pt_conv_03-19_14-07-27-172272.json (13.1 KB) | pt_kf_03-19T14-07-27-197226.json (2.77 KB)
Conversation 12
Knowledge proxy-computation example where dynamically executed code calls the tutor API directly to request user data and branch on validated responses.
Conversation 12 API actions: knowledge.create_version | knowledge.compute
1 graph render2 ledgersconversation and theory ledgers
Raw file links
Core files: scripted_conversations.json (3.16 KB) | dependency_graph.json (22.9 KB)
Visualizations: dep_viz_03-19T14-07-33-857323.png (303 KB)

Text-state ledgers: pt_conv_03-19_14-07-33-460953.json (5.64 KB) | pt_kf_03-19T14-07-33-486984.json (717 B)
Conversation 13
CST edge-case example covering renames, scalar replacements, node deletion, failed multi-node targeting, and whole-class replacement.
Conversation 13 API actions: knowledge.create_version | knowledge.replace_node | knowledge.read_version | knowledge.compute
1 graph render2 ledgersconversation and theory ledgers
Raw file links
Core files: scripted_conversations.json (9.15 KB) | dependency_graph.json (49.0 KB)
Visualizations: dep_viz_03-19T14-07-35-895813.png (2.25 MB)

Text-state ledgers: pt_conv_03-19_14-07-34-276608.json (12.5 KB) | pt_kf_03-19T14-07-34-309197.json (2.33 KB)
Conversation 14
Version-close example showing that closing a knowledge version clears its dynamic state while leaving static file content readable.
Conversation 14 API actions: knowledge.create_version | knowledge.compute | knowledge.close
1 graph render3 ledgersconversation and theory ledgers
Raw file links
Core files: scripted_conversations.json (6.02 KB) | dependency_graph.json (35.3 KB)
Visualizations: dep_viz_03-19T14-07-39-803280.png (2.27 MB)

Text-state ledgers: pt_conv_03-19_14-07-38-681469.json (10.9 KB) | pt_kf_03-19T14-07-38-707327.json (209 B) | pt_kf_03-19T14-07-38-743793.json (210 B)
Conversation 15
List-manipulation example that tracks dependencies through append calls, slicing, and conditional reads over a dynamically populated list.
Conversation 15 API actions: knowledge.create_version | knowledge.insert_node | knowledge.compute
1 graph render2 ledgersconversation and theory ledgers
Raw file links
Core files: scripted_conversations.json (4.43 KB) | dependency_graph.json (27.5 KB)
Visualizations: dep_viz_03-19T14-07-42-779304.png (862 KB)

Text-state ledgers: pt_conv_03-19_14-07-42-095979.json (7.62 KB) | pt_kf_03-19T14-07-42-125478.json (433 B)
Conversation 16
Knowledge proxy-computation example tracing API-derived values through lists, dicts, nested structures, helper functions, attribute access, and subscripting.
Conversation 16 API actions: knowledge.create_version | knowledge.compute | memory.insert_node
1 graph render3 ledgersconversation, theory, and memory ledgers
Raw file links
Core files: scripted_conversations.json (10.6 KB) | dependency_graph.json (43.7 KB)
Visualizations: dep_viz_03-19T14-07-46-784621.png (1.05 MB)

Text-state ledgers: pt_conv_03-19_14-07-43-668032.json (12.4 KB) | pt_kf_03-19T14-07-43-694719.json (3.44 KB) | pt_mem_memory_py_ef159b00ec9c.json (289 B)
Conversation 17
Memory CST and proxy-computation example covering insert, find, replace, and compute operations over memory-resident helpers that can participate in direct API calls.
Conversation 17 API actions: memory.read | memory.insert_node | memory.find_node | memory.find_all_nodes | memory.replace_node | memory.compute
1 graph render2 ledgersconversation and memory ledgers
Raw file links
Core files: scripted_conversations.json (5.44 KB) | dependency_graph.json (32.3 KB)
Visualizations: dep_viz_03-19T14-07-49-238665.png (1.01 MB)

Text-state ledgers: pt_conv_03-19_14-07-48-118722.json (9.76 KB) | pt_mem_memory_py_458f88811a70.json (991 B)
Conversation 18
Control-flow example showing dependencies propagating through if/else branches, loops, branch switching, and API-backed loop bounds.
Conversation 18 API actions: knowledge.create_version | memory.insert_node | knowledge.insert_node | knowledge.compute
1 graph render3 ledgersconversation, theory, and memory ledgers
Raw file links
Core files: scripted_conversations.json (7.84 KB) | dependency_graph.json (36.8 KB)
Visualizations: dep_viz_03-19T14-07-54-242200.png (1.75 MB)

Text-state ledgers: pt_conv_03-19_14-07-50-342251.json (10.1 KB) | pt_kf_03-19T14-07-50-372244.json (1.61 KB) | pt_mem_memory_py_b9fc45eae52c.json (432 B)
Conversation 19
Initialization example that incrementally assembles a module and checks that reads and method calls depend only on the inserted definitions they actually use.
Conversation 19 API actions: knowledge.create_version | knowledge.insert_node | conversation.clear_context | knowledge.compute
1 graph render2 ledgersconversation and theory ledgers
Raw file links
Core files: scripted_conversations.json (12.7 KB) | dependency_graph.json (55.9 KB)
Visualizations: dep_viz_03-19T14-07-58-082900.png (3.95 MB)

Text-state ledgers: pt_conv_03-19_14-07-56-464007.json (13.2 KB) | pt_kf_03-19T14-07-56-495483.json (2.31 KB)
Conversation 21
Loop-tracking example covering tutor-driven loop counts, API-backed while conditions, nested loops, break/continue behavior, and comprehension filters.
Conversation 21 API actions: knowledge.create_version | memory.insert_node | knowledge.compute
1 graph render3 ledgersconversation, theory, and memory ledgers
Raw file links
Core files: scripted_conversations.json (12.2 KB) | dependency_graph.json (60.4 KB)
Visualizations: dep_viz_03-19T14-08-13-417490.png (1.66 MB)

Text-state ledgers: pt_conv_03-19_14-08-03-700697.json (19.9 KB) | pt_kf_03-19T14-08-03-763681.json (3.65 KB) | pt_mem_memory_py_b1e5ccb85a84.json (539 B)
Conversation 33
Read/write dependency example contrasting blind overwrites, simple reads, read-modify-write chains, and function-mediated global access.
Conversation 33 API actions: knowledge.create_version | knowledge.compute
1 graph render2 ledgersconversation and theory ledgers
Raw file links
Core files: scripted_conversations.json (5.87 KB) | dependency_graph.json (30.1 KB)
Visualizations: dep_viz_03-19T14-08-16-238526.png (1.52 MB)

Text-state ledgers: pt_conv_03-19_14-08-15-467080.json (8.51 KB) | pt_kf_03-19T14-08-15-498344.json (463 B)
Conversation 34
Minimal observe-branch example showing branch observation promotion and verification against the latest mainline version.
Conversation 34 API actions: knowledge.create_version | observe.observe_branch | knowledge.compute
2 graph renders3 ledgersconversation and theory ledgers
Raw file links
Core files: scripted_conversations.json (2.55 KB) | dependency_graph.json (26.2 KB)
Visualizations: dep_viz_03-19T14-08-18-104568.png (162 KB) | dep_viz_03-19T14-08-18-253524.png (134 KB)


Text-state ledgers: pt_conv_03-19_14-08-17-817051.json (5.24 KB) | pt_conv_03-19_14-08-18-159651.json (3.83 KB) | pt_kf_03-19T14-08-17-845719.json (218 B)
Conversation 35
Typical replace-observation flow where an updated version breaks replication, a replacement computation is supplied, and a follow-up observation can promote again.
Conversation 35 API actions: knowledge.create_version | observe.observe | observe.replace_observation
3 graph renders5 ledgersconversation and theory ledgers
Raw file links
Core files: scripted_conversations.json (4.72 KB) | dependency_graph.json (35.9 KB)
Visualizations: dep_viz_03-19T14-08-19-197842.png (163 KB) | dep_viz_03-19T14-08-22-193866.png (343 KB) | dep_viz_03-19T14-08-22-289765.png (42.6 KB)


Text-state ledgers: pt_conv_03-19_14-08-18-900566.json (4.99 KB) | pt_conv_03-19_14-08-19-252073.json (6.07 KB) | pt_conv_03-19_14-08-22-289885.json (3.32 KB) | pt_kf_03-19T14-08-18-933761.json (215 B) | pt_kf_03-19T14-08-20-409116.json (246 B)
Conversation 36
Branch-and-merge example that seeds a main observation, promotes branch-only work in a buffer, and then merges once the branch surpasses the main chain.
Conversation 36 API actions: knowledge.create_version | observe.observe | observe.observe_branch | knowledge.compute
4 graph renders6 ledgersconversation and theory ledgers
Raw file links
Core files: scripted_conversations.json (6.54 KB) | dependency_graph.json (47.3 KB)
Visualizations: dep_viz_03-19T14-08-23-603403.png (168 KB) | dep_viz_03-19T14-08-25-091985.png (160 KB) | dep_viz_03-19T14-08-26-555682.png (446 KB) | dep_viz_03-19T14-08-26-722687.png (321 KB)


Text-state ledgers: pt_conv_03-19_14-08-23-328459.json (5.00 KB) | pt_conv_03-19_14-08-23-646991.json (8.16 KB) | pt_conv_03-19_14-08-26-645282.json (3.83 KB) | pt_kf_03-19T14-08-23-354774.json (218 B) | pt_kf_03-19T14-08-24-794841.json (291 B) | pt_kf_03-19T14-08-26-292921.json (406 B)
Conversation 37
Buffer-namespace edge case showing that observe-branch can seed a buffer on a replication-broken update while replace-observation on that buffer is rejected.
Conversation 37 API actions: knowledge.create_version | observe.observe | observe.observe_branch | observe.replace_observation
3 graph renders4 ledgersconversation and theory ledgers
Raw file links
Core files: scripted_conversations.json (5.12 KB) | dependency_graph.json (38.8 KB)
Visualizations: dep_viz_03-19T14-08-28-547873.png (160 KB) | dep_viz_03-19T14-08-29-283058.png (200 KB) | dep_viz_03-19T14-08-29-370797.png (351 KB)


Text-state ledgers: pt_conv_03-19_14-08-28-245012.json (4.99 KB) | pt_conv_03-19_14-08-28-593467.json (7.68 KB) | pt_kf_03-19T14-08-28-276862.json (215 B) | pt_kf_03-19T14-08-28-613396.json (285 B)