Equality Proxy
This package archives the canonical observation-loss baseline used for threshold evaluation. It includes the current 36-example evaluation set, a flattened CSV table of latest versus updated losses, summary statistics, and static plus interactive decision-space views.
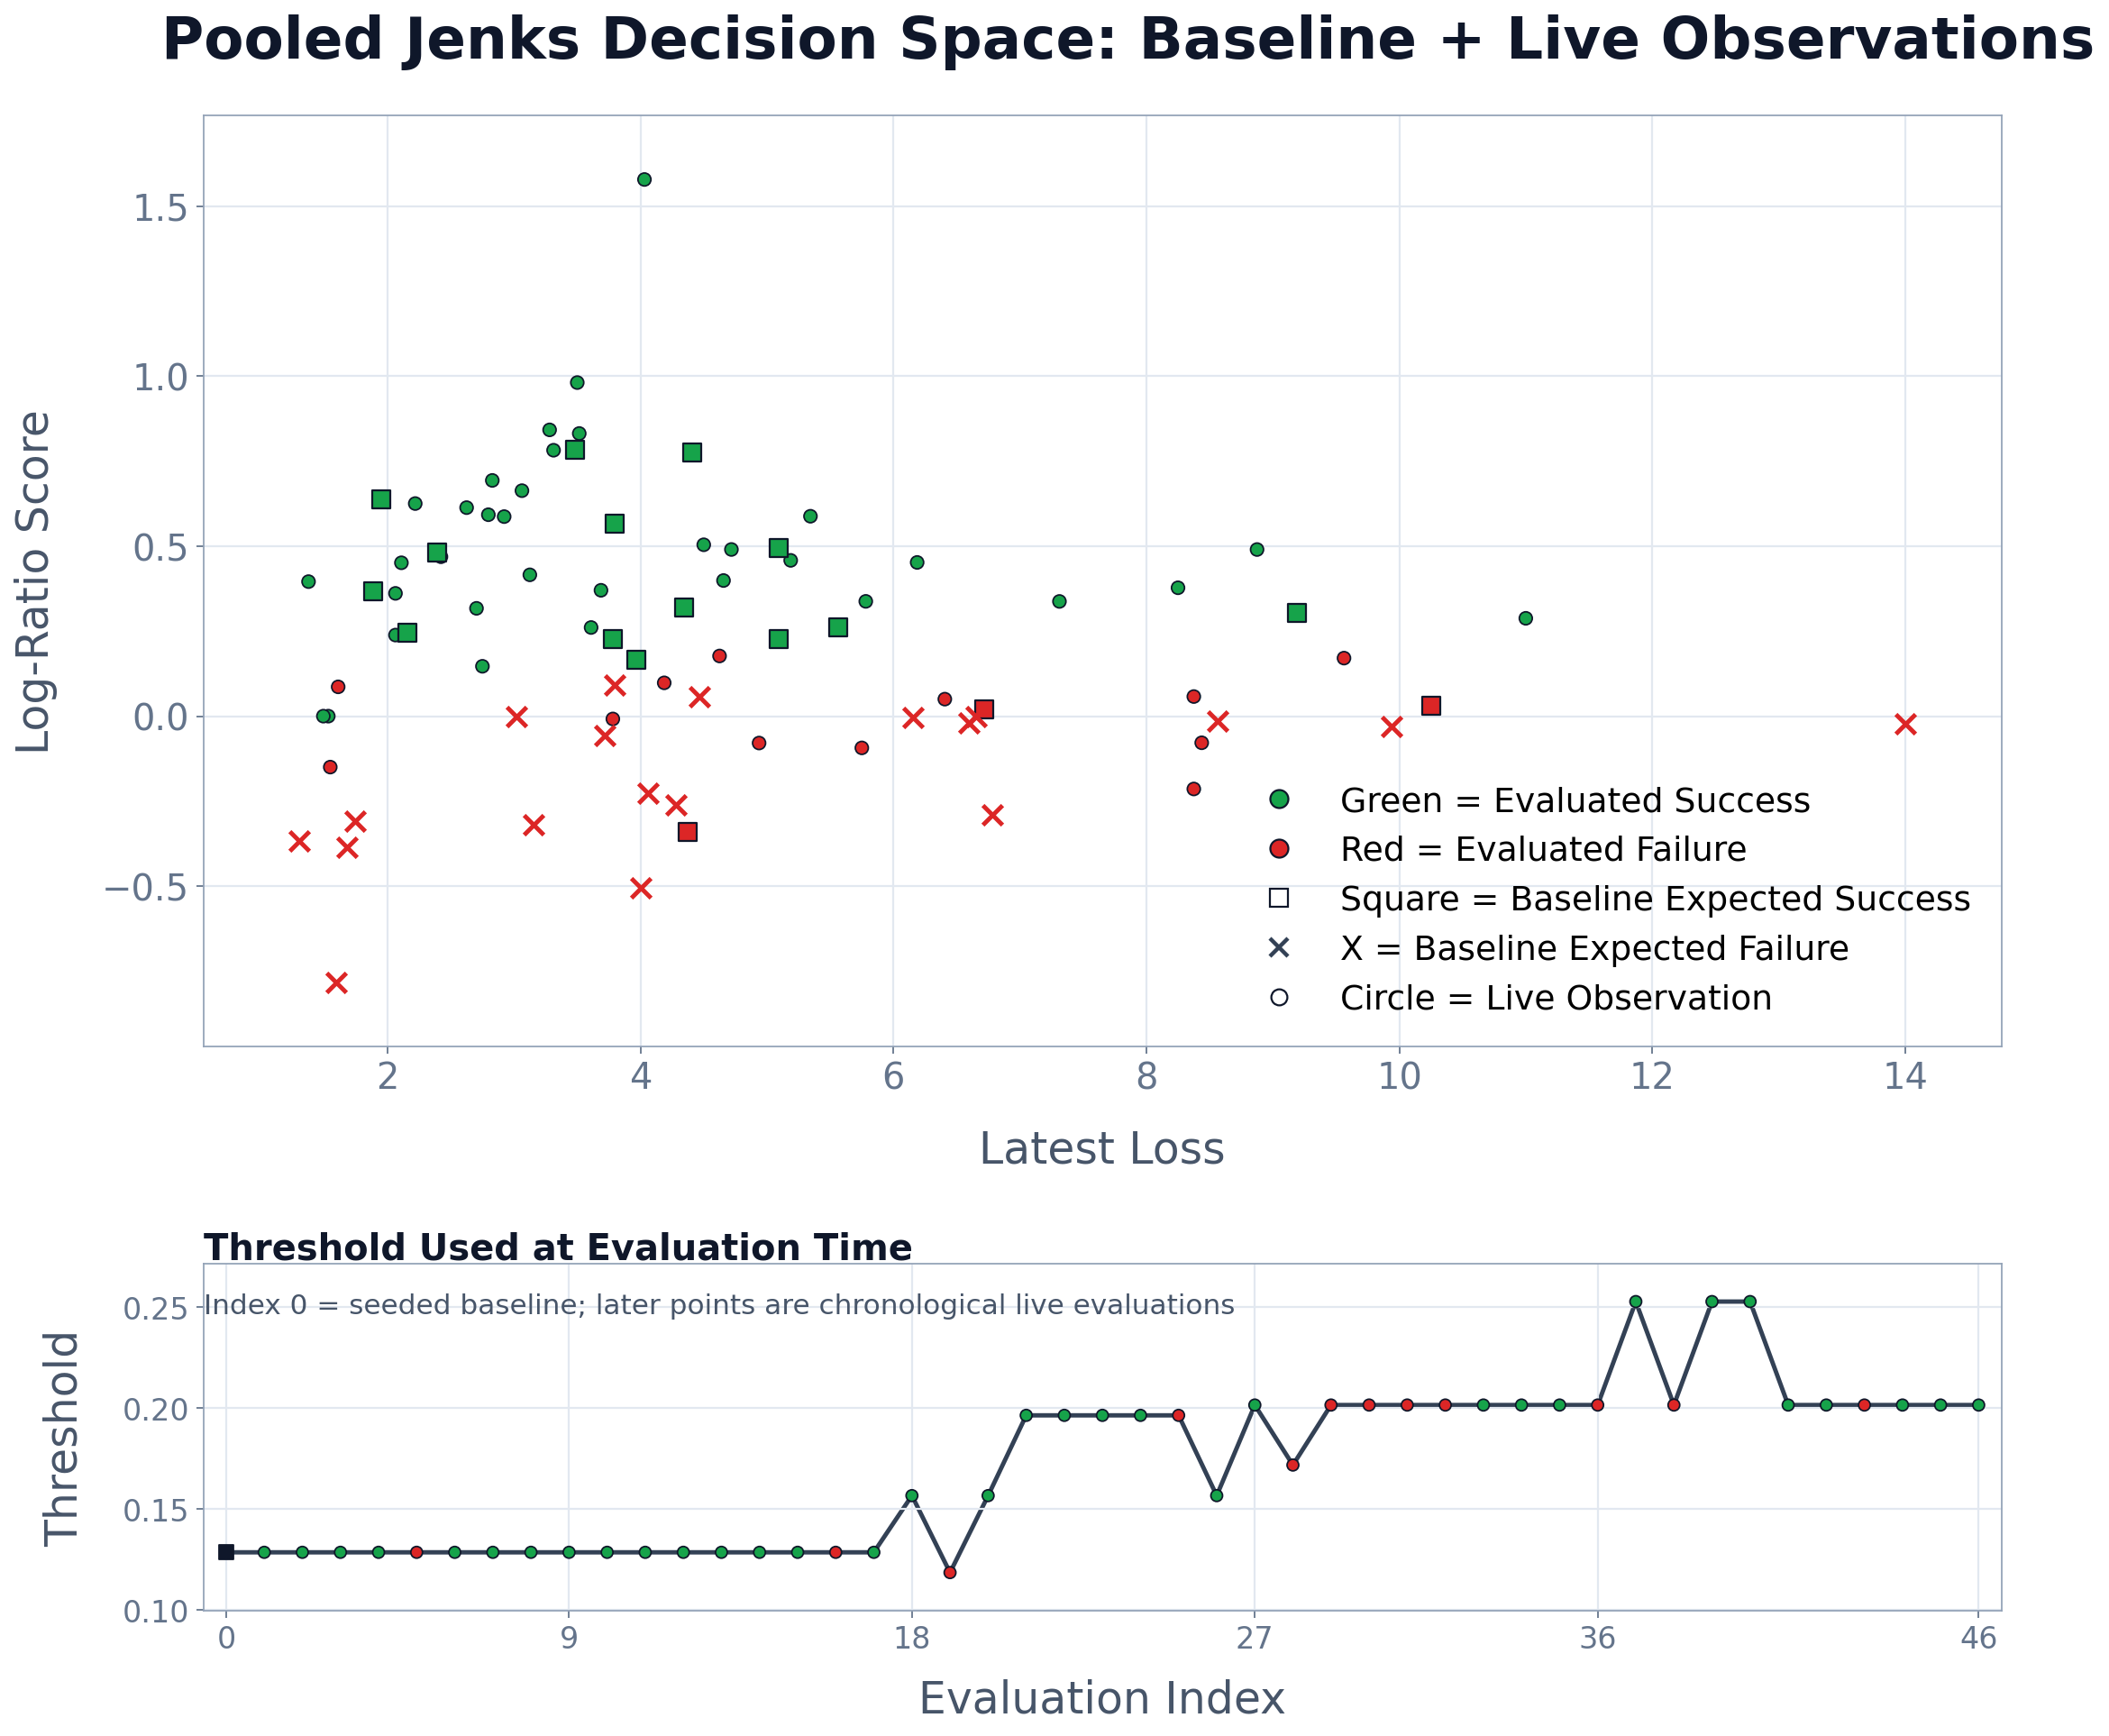
In the running system, the decision threshold is not fixed to the baseline shown here. On each new observation evaluation, the thresholding routine pools this seeded baseline with the accumulated live observation records collected so far and refits the natural-breaks split on that combined score distribution. So the threshold updates over time as new observations are added. This artifact shows the seeded baseline and its associated diagnostics, which provide the starting calibration and a stable public reference point.
Download bundle:
Summary
- Seeded baseline examples:
36 - Seeded baseline successful evaluations:
14 - Seeded baseline failed evaluations:
22 - Threshold rule:
natural-breaks split on the log-ratio score - Seeded baseline threshold value:
0.1285 - Threshold at most recent live observation:
0.2016
Jenks Decision Space
This interactive view combines the seeded baseline examples with the accumulated live observations from the observation pool. Green and red markers show evaluated success versus failure. Baseline expected-success examples are squares, baseline expected-failure examples are X markers, and live observations are circles. The lower panel shows the threshold that was actually used at each evaluation time, and hovering any point reveals the underlying observation context, computation, results, and loss-evaluation summary. The static PNG remains available below as a compact archival reference.
For this figure:
- Latest Loss is the loss on the tutor or sensor target when the observation context is paired with the computation result from the incumbent latest knowledge version.
- Updated Loss is the loss on that same target and context when the computation result comes from the updated candidate version being evaluated.
- Loss Delta is
Latest Loss - Updated Loss, so positive values mean the candidate version matched the target better than the incumbent.
Open in a new tab:
Static Reference Figure
Included Files
- README.md (837 B): Plain-language overview of the artifact contents and baseline.
- package_manifest.json (2.22 KB): Public overview manifest with the baseline counts, threshold summary, metric definitions, and file guide.
- default_observations.json (51.4 KB): Canonical 36-example observation-loss baseline.
- observation_loss_table.csv (6.82 KB): Flattened per-example table for browser or spreadsheet inspection.
- jenks_decision_space.png (283 KB): Static decision-space figure combining the seeded baseline, live observations, and threshold trajectory over evaluation order.
- jenks_decision_space_interactive.html (4.85 MB): Interactive Plotly companion with hover summaries for each baseline and live observation point.